Product · The workspace
From raw responses to the client deck, in one place
Tensr is the analysis workspace for survey data. Bring the file in, clean and weight it, ask for the tables you need and ship the report, with every number traceable to the people who gave it.
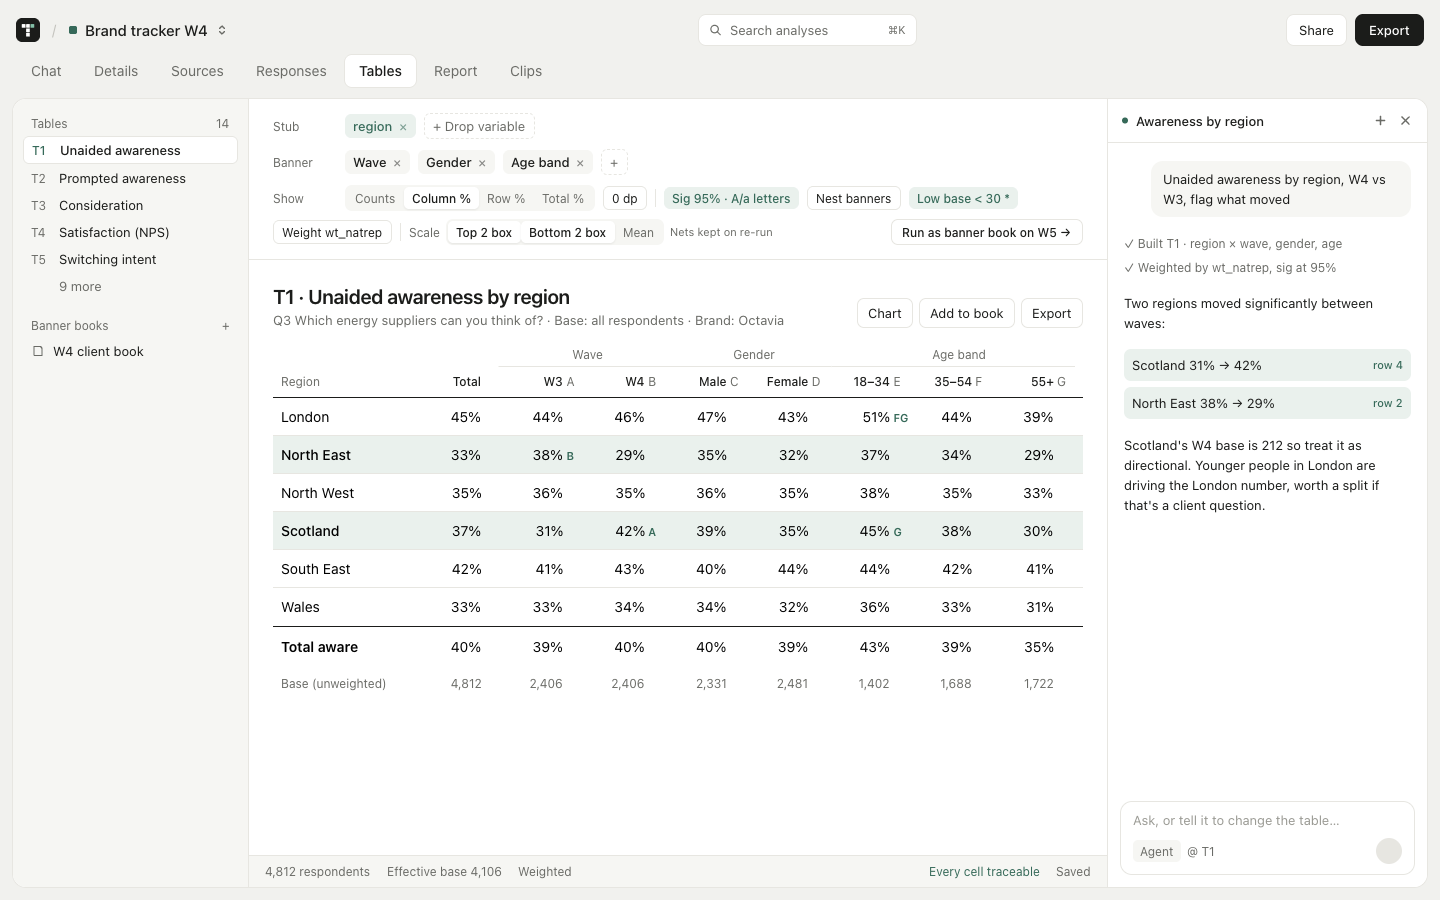
01 · Sources
Bring data in
Every wave, every market, one dataset you can trust
Connect the tools you already use, or drop in a file. Tensr reads them. Prolific fielding and live Qualtrics sync are coming soon.
Bring data in
.sav, .dta, CSV, Excel, Triple-S and Parquet. Labels, missing codes and measurement levels come across intact.
Merge waves
Join or stack two files, or fuse three or more. You see every variable it re-mapped.
Levelled data
Loops and hierarchies, like brands per respondent, analysed at the right level without reshaping by hand.
The file stays the file
A weight, a recode, or a merge saves a new version. The file you uploaded stays.
02 · Responses
Clean and prepare
Clean it before it reaches a table
A live sheet of your data with the checks already run. Fix it here once and every table downstream picks it up.
Sheet and filters
Labels or values, click a code to filter.
Weighting
Rake to targets, see the effective base.
Quality checks
Speeders and routing faults flagged early.
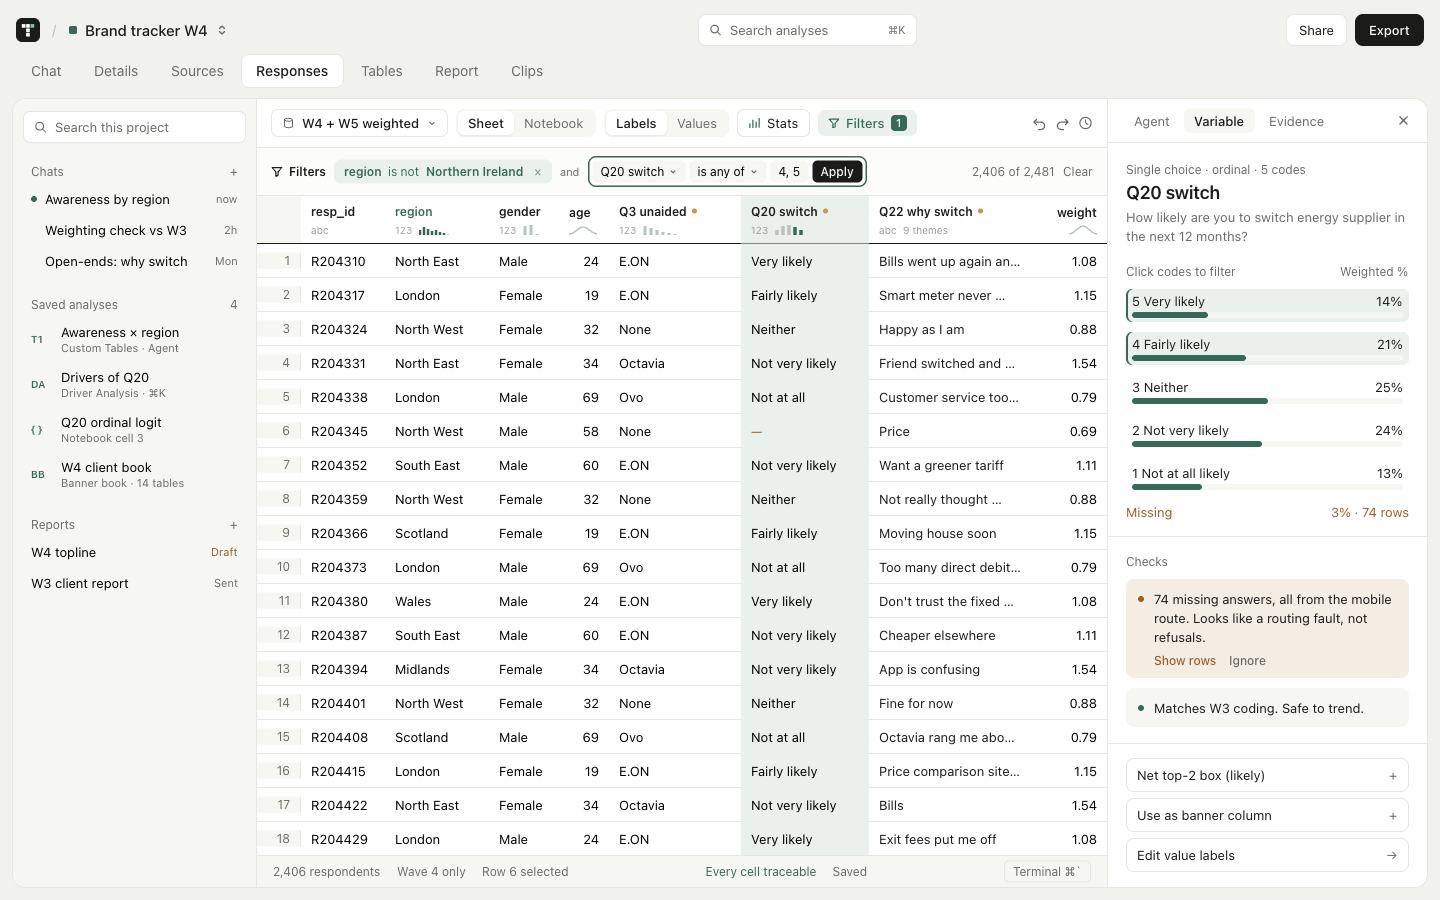
Open-end coding
In about a minute
Codeframes you can edit, usable as a banner
Hundreds of open ends coded into themes in about a minute. The AI proposes a code frame you can edit, then the themes are ready to cut by any group.
03 · Chat agent
Ask in plain English
An analyst that plans first, asks when it is not sure, and shows its working
Type the question the client asked. The agent picks the method and tells you what it did, step by step.
Mode 1
Ask
Quick answers about the data. Reads, and leaves the file as it is.
Mode 2
Plan
Lays out the steps first. You approve or edit before anything runs.
Mode 3
Agent
Merges, weights, and builds the book, pausing when a choice is yours.
Every mode
Shown
Each step lists the weight, base, and test it used, so you can check it.
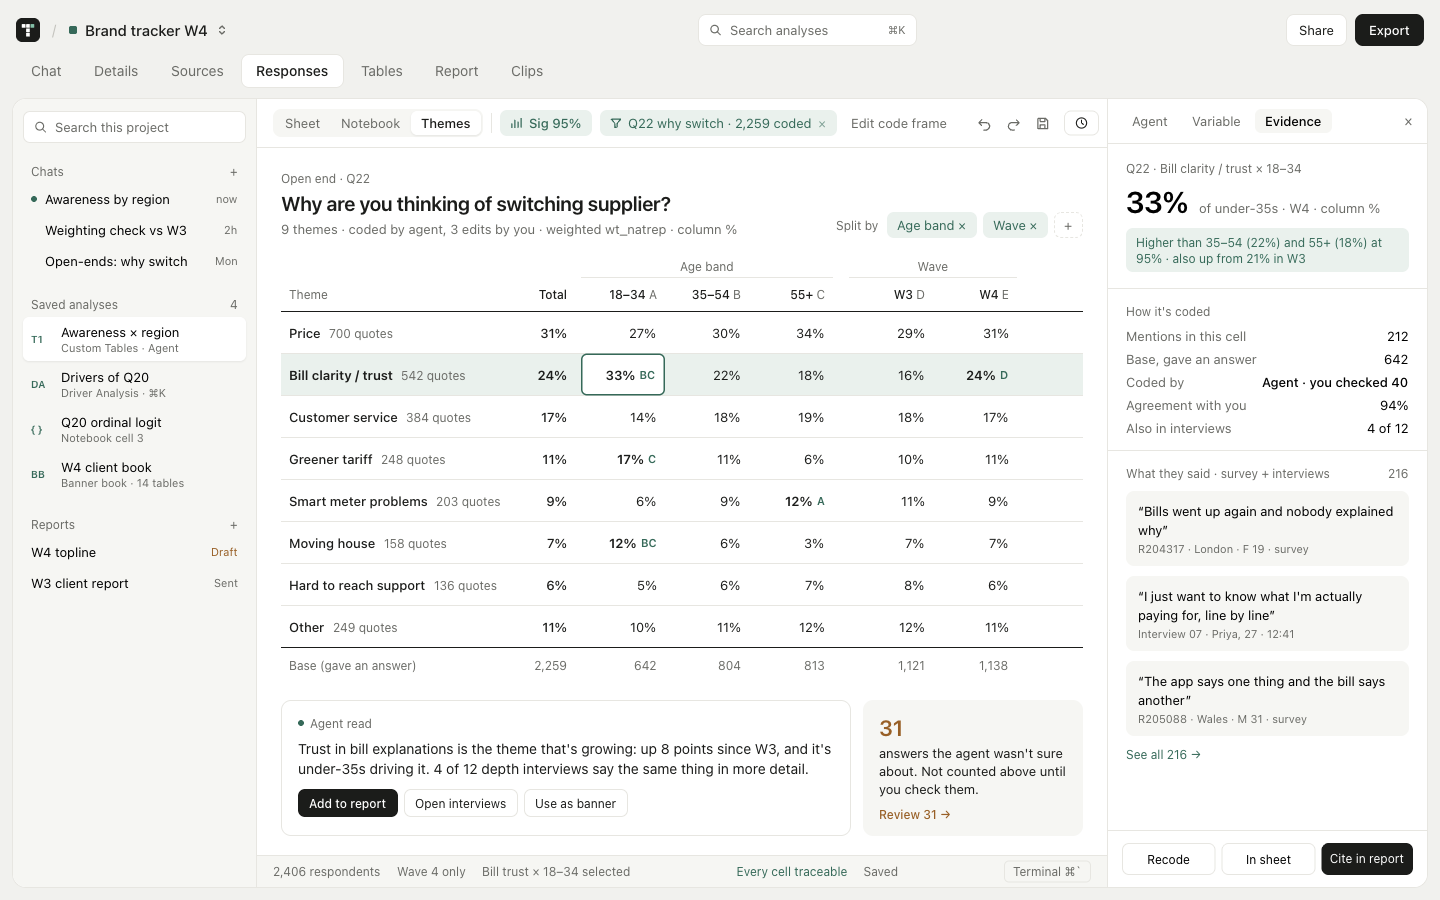
04 · Tables
Banner books
The tab book, the way you'd spec it
Drag a stub and a banner or just describe the table. Save the spec and rerun it on the next wave's data. Excel and PowerPoint take the grid you signed off.
05 · Report
Deliver
The book you signed off, ready to send
Excel and PowerPoint for the banner. CSV, Markdown, or print for the write-up. You export the banner you signed off.
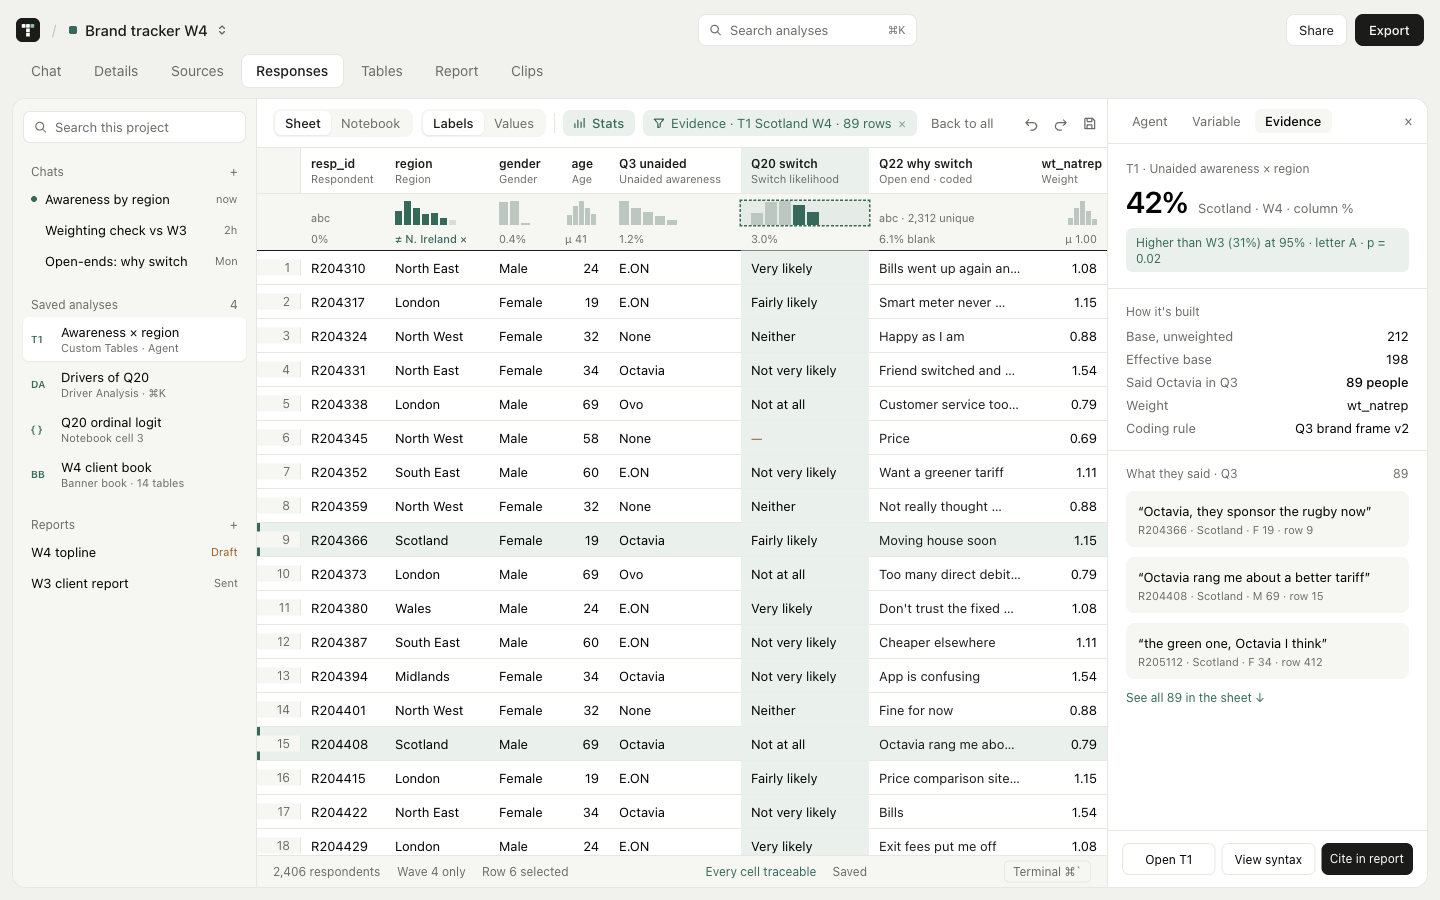
06 · Traceability
Check anything
Open a cell. See the people.
Click any cell and see the respondents, rows, weight and test that produced it.
83 analyses
⌘K or just ask
The methods you reach for, without the syntax
Run any of them from the ⌘K palette, a dialog, or a sentence in chat. The list is the 83 documented analyses.
01
Tabulation
Crosstabs, banner books, nets, means and Top 2 / Bottom 2 box on scales.
02
Significance
Column proportions, t-tests, chi-square, ANOVA and post-hoc.
03
Regression
Linear, logistic and ordinal models with diagnostics.
04
Drivers
Key driver and relative importance analysis.
05
Choice modelling
MaxDiff and conjoint, as counts, multinomial logit, and hierarchical Bayes.
06
Segmentation
Factor, cluster and correspondence analysis.
07
Pricing
Van Westendorp and Gabor-Granger curves.
And more
83
Weighting, reliability, and the rest of the documented list.
The details
Everything else in the box
The parts you check before you trust it
Weights, code, and who changed what, in the same project as the tables.
Analysis report
Checked, then explained
Assumption checks, effect sizes, post-hoc tests and a plain-language read.
Exports
Out in the shapes that exist
Banners go to Excel or PowerPoint. A write-up goes to CSV, Markdown, or the browser print dialog. A .sav comes back with an .sps weight file.
Weights
Versions, not overwrites
Rake to targets as a new weight version. The one you uploaded stays, and so does the earlier weight.
Charts
From the table
Bar charts from a table, and a chart you can export.
Notebook
R, on the open file
R cells load the open dataset. An R script is there for the analyses that have one.
Collaboration
The team, live
Live presence. Comment on a cell, a chart, or a section, reply, and resolve. Share a session by link as a viewer or an editor.
Plugins
Build, publish, earn
Write a toolkit in Python, R, JavaScript or TypeScript. The agent and ⌘K can use it, and you can charge for it. Plugins run with no network access.
Security
Encrypted, and never for training
AES-256 at rest, HTTPS in transit, hosted in AWS US East. Tensr never trains models on your data.
Run your next wave in Tensr.
Start a 30-day free trial, or send us last wave's file and we'll rebuild your tab book in Tensr on the call.
Book a demo →Ask about Tensr on